

Rauq
Goblin Guru

- Rauq Goblin Guru
This guide focuses on the LSJ and DIY LSJ tuning expertise, but certain principles may apply to L61 and LE5 tuning as well. Use at your own caution and discretion.
This guide covers setting up channels, histograms, and datalogging for the LSJ. Properly configured settings will allow you to perform reliable tune revisions for fueling, including both VE and MAF tuning.
On the LSJ, every channel is logged as a Polling Channel (where HP Tuners actively requests data) rather than a Broadcast Channel. Because of this, stripping out unused channels results in a faster data refresh rate.
Prerequisite: You must have a Wideband O2 sensor installed and wired. If you need help getting that set up, refer to Wiring Wideband O2 Sensors.
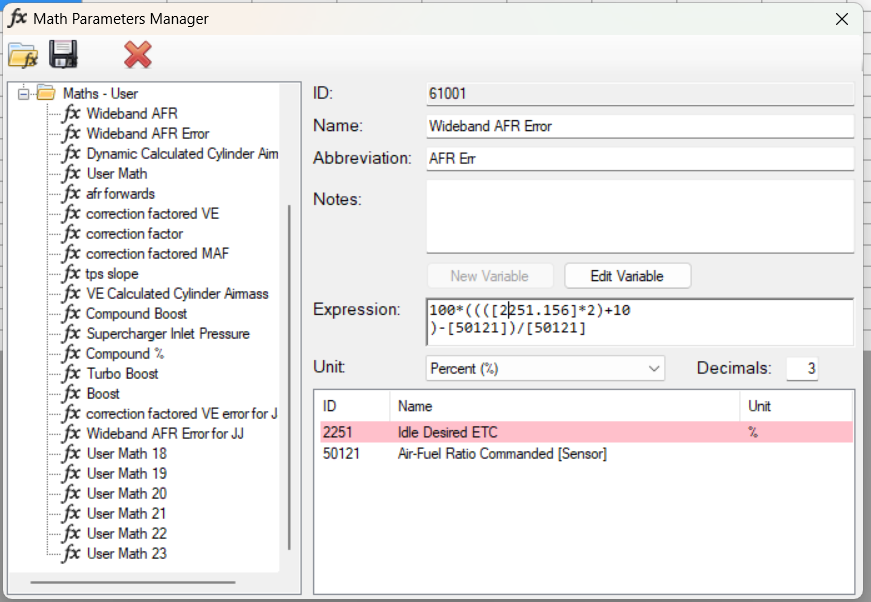
Remember when we said this was a chicken-and-egg exercise? At this juncture, if you're referencing a channel that isn't being logged, the parameter will turn red below (just for demonstration!)
VE Tuning Chart Setup
Column Axis (MAP):
Cell Hits: Set the minimum cell hits to at least 20 (or 100 for higher-quality data) to avoid erratic corrections in rarely-touched cells.
Cold Engine Filter: Add a filter to ignore data while the engine is cold (where .242 indicates degrees Fahrenheit):
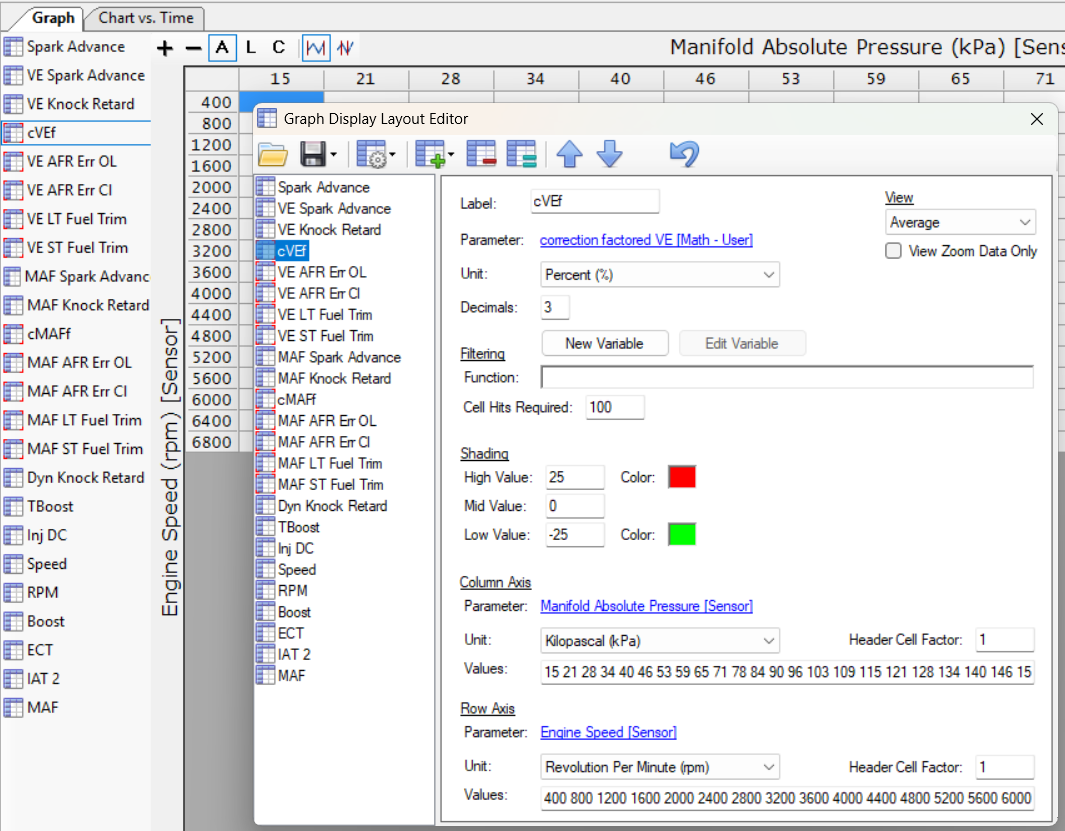
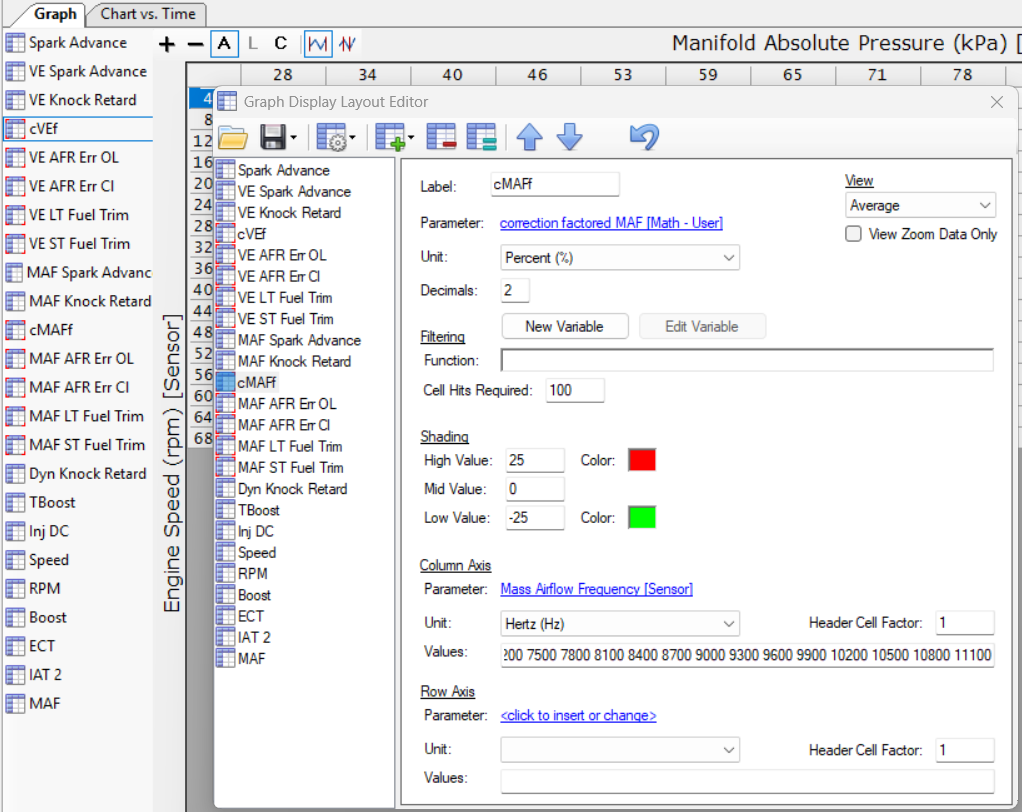
Tip: Turning off closed-loop mode makes the logging process significantly faster.
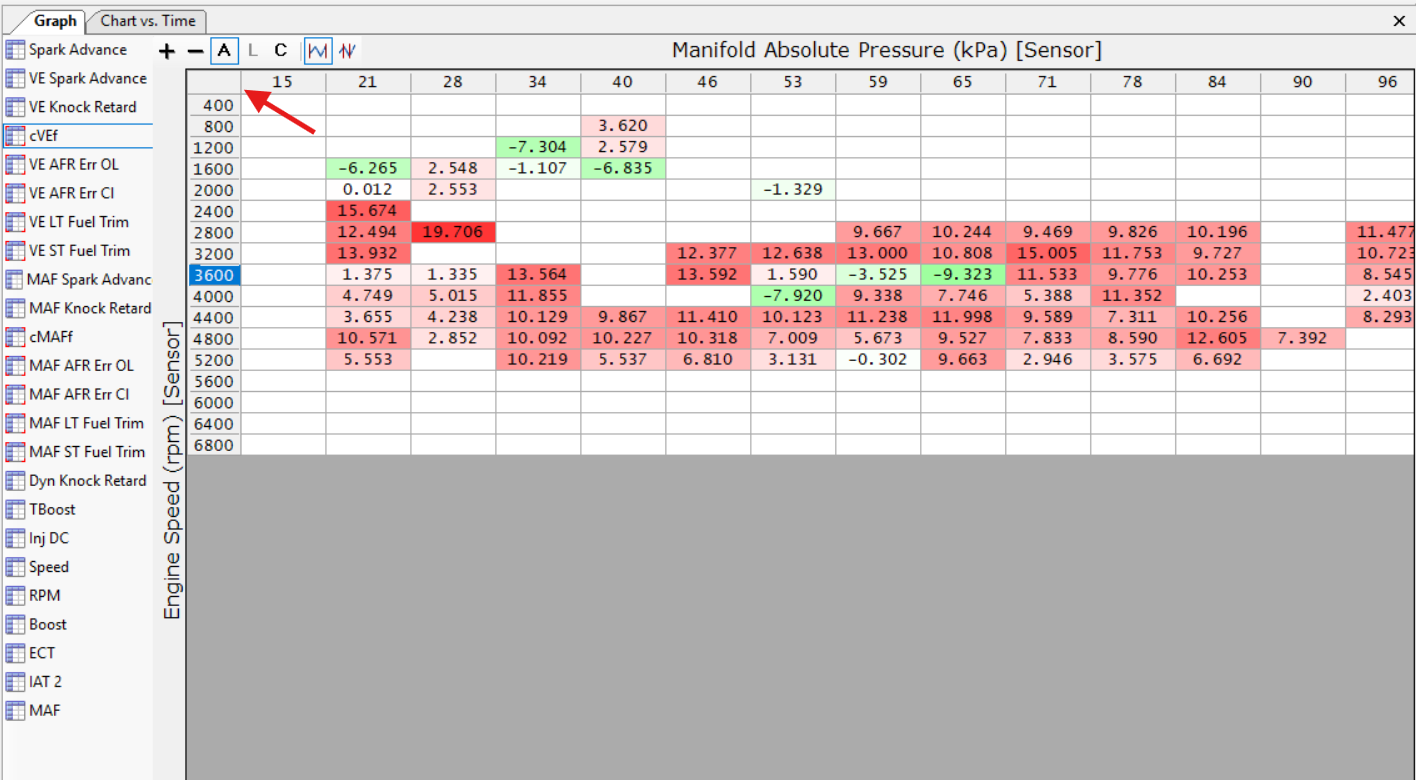
If I set minimum cell hits to 100, then click the A at the top to see the average WB Error, it might look something like below. DON'T PAY ATTENTION TO MY NUMBERS, THEY'RE PARTICULAR TO MY SETUP, primarily in that I don't use any VE above 3000rpm where I can already make well in excess of the top of the VE table max of 215kPa (about 31psi absolute - 1 atm = ~16.5psi of boost). Click the top left empty axis cell (where the red arrow is) to copy the whole table, then flip over to your tune.
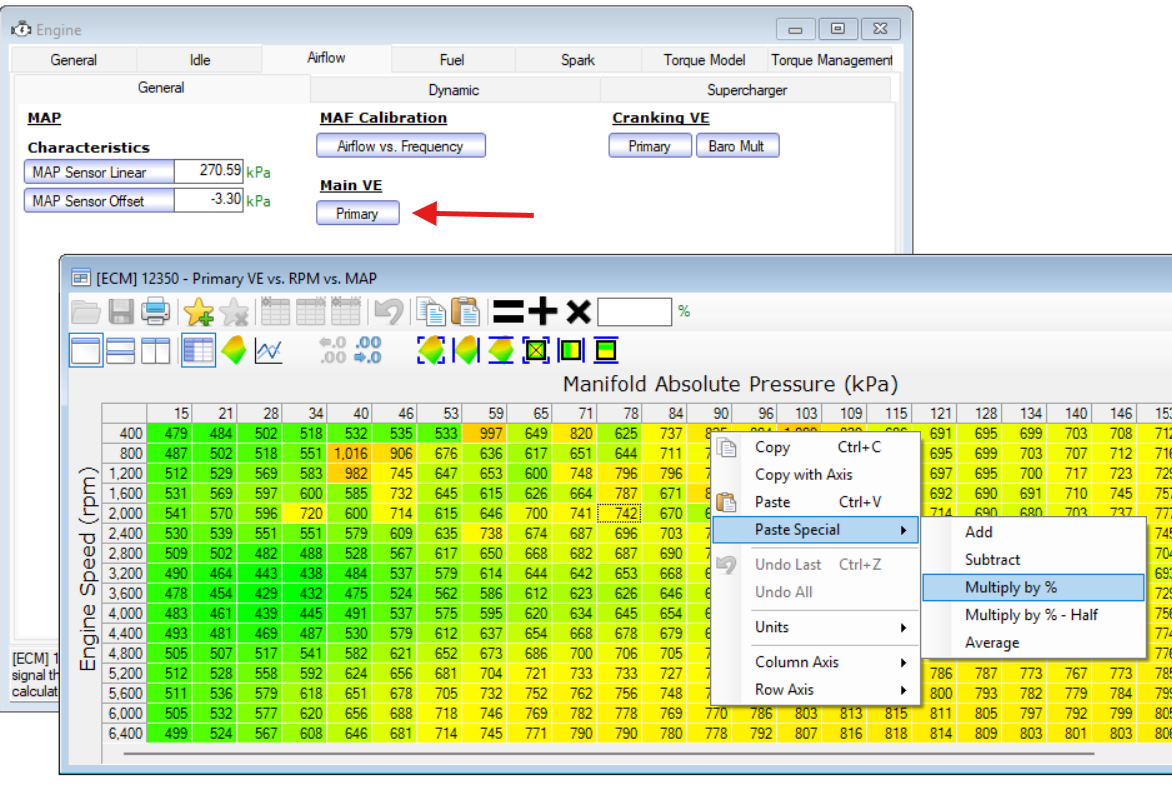
Flip back over to your tune, go to the VE table, right click anywhere and either Paste Special > Multiply By % or by Half. This is where some discretion and responsibility is warranted. If you have a ton of good data that's significant % error, then by all means go ahead and Multiply by % and do some manual smoothing. If you have some significant % error but only 30-40 cell hits, you may want to Multiply by % Half so as to not overshoot your ideal. If you're taking fuel out of it (green % error in the log), you don't want to overshoot and make it lean, but if you're adding fuel, you don't want to come up short and not make it as rich as it needs to be in correction.
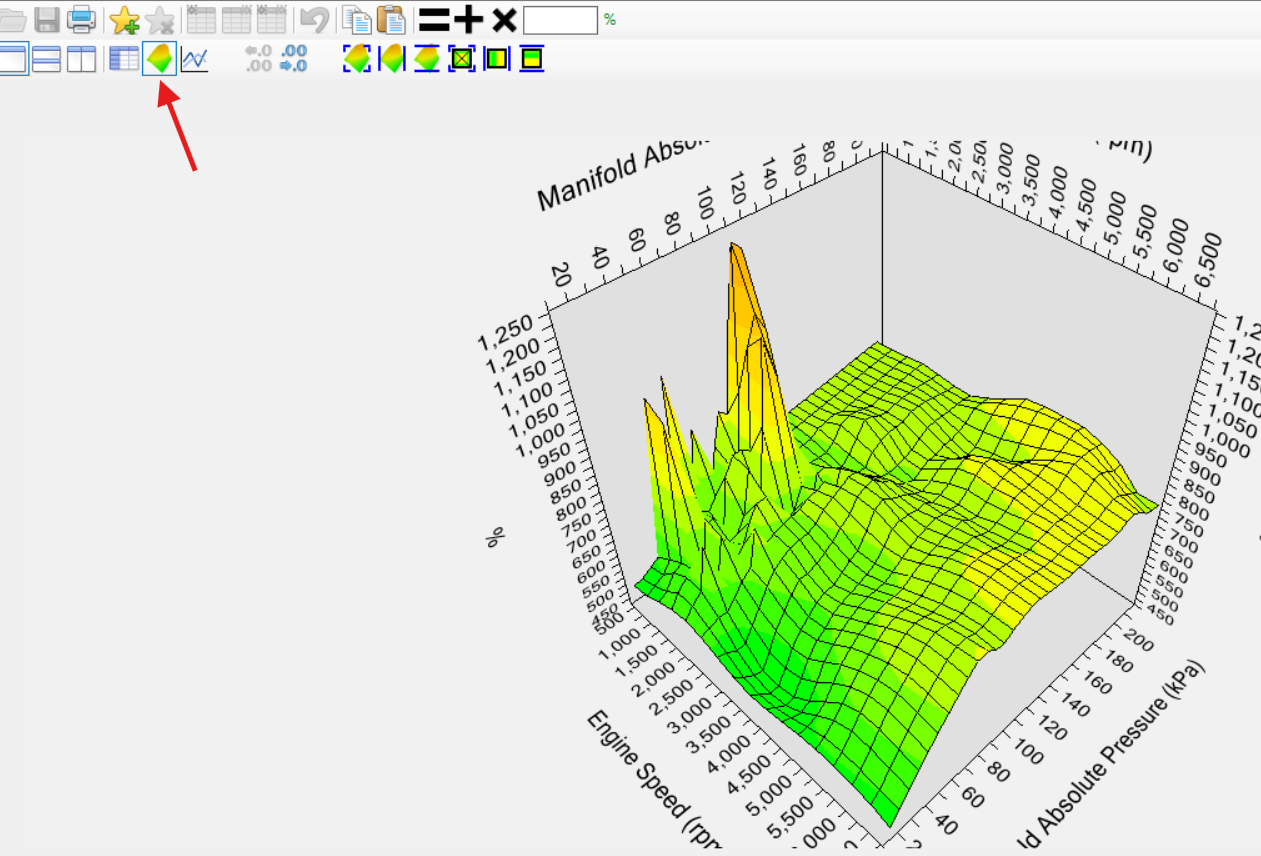
With some restraint, you can also do some manual smoothing, either with the built in buttons (more effectively done by highlighting a cell region and then hitting a smooth/interpolate button) or with your the keyboard. You can see the spike at 40kPa and 800rpm pretty easily in the 3d model (red button). This should probably be smoothed out (and it was, this is an old tune).
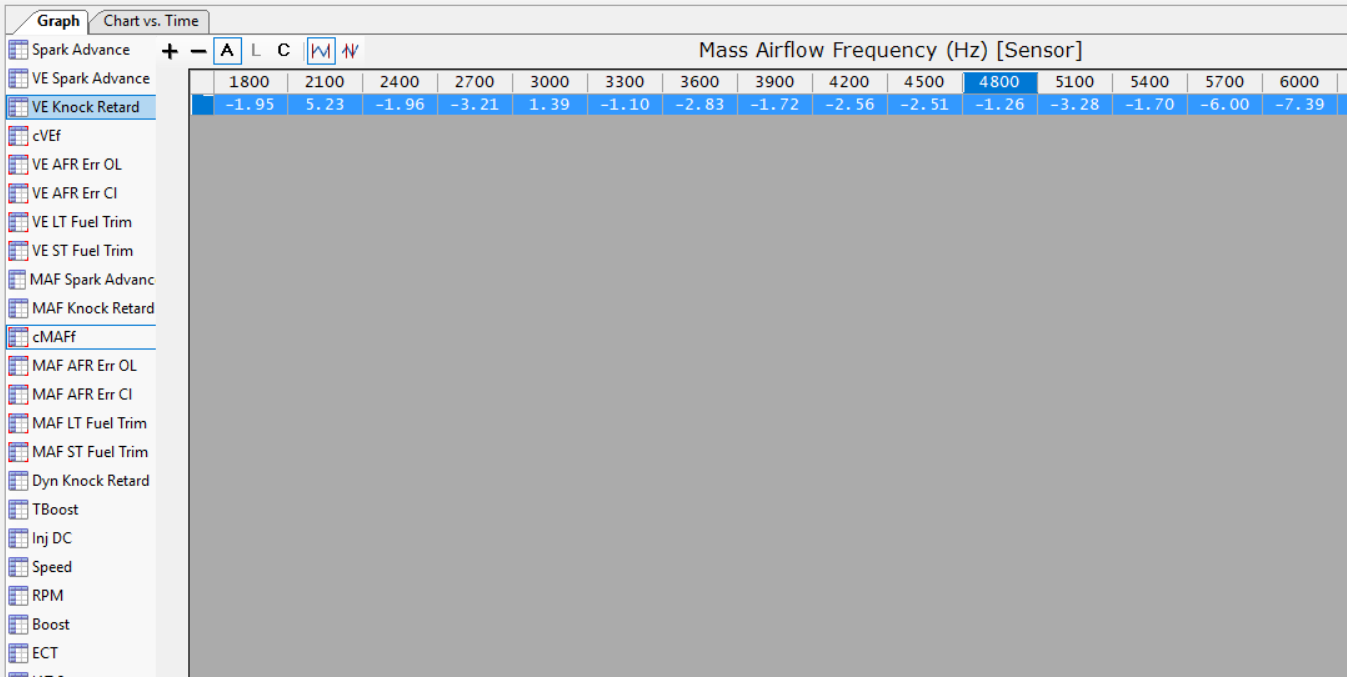
When you can go for a drive and have all your error <10%, that's probably close enough. Copy your VE table from your tuning tune back into your main tune and then flash your MAF tuning tune. Process is the same for MAF tuning, except only a single axis.
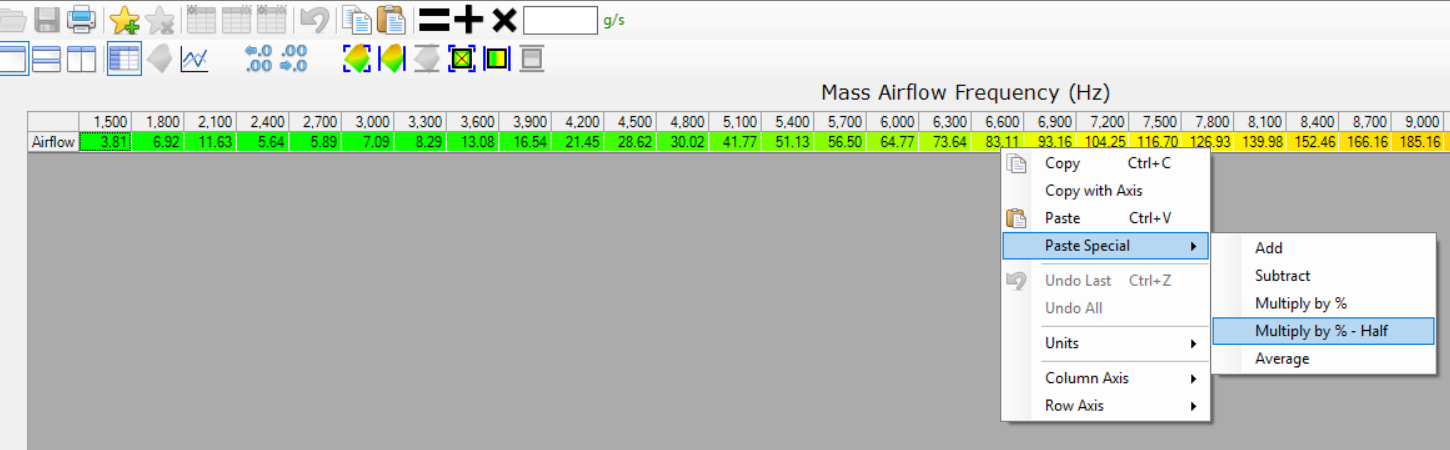
Once your MAF error is close, copy that data back into your VE tuning tune and your main tune, then you're good to go!
I can also touch on spark tuning, which requires another Math Parameter to set up whereas any LS engine is already preconfigured in HP Tuners. The challenge an LSJ has is, whereas you can do a decent spark tune on the street in an N/A vehicle, with forced induction you're probably going to go past max power before you start knock retarding, so it's not nearly as productive off a dyno.
This is all word vomited out as a first draft, so I welcome corrections or requests for clarifications, including formatting, which I will make in the original post where appropriate.
This guide covers setting up channels, histograms, and datalogging for the LSJ. Properly configured settings will allow you to perform reliable tune revisions for fueling, including both VE and MAF tuning.
1. Initial Setup
Setting up channels and histograms is a chicken-and-egg situation: you need the logging channels set up to build your histograms, but building histograms often reveals missing channels in your log.On the LSJ, every channel is logged as a Polling Channel (where HP Tuners actively requests data) rather than a Broadcast Channel. Because of this, stripping out unused channels results in a faster data refresh rate.
Prerequisite: You must have a Wideband O2 sensor installed and wired. If you need help getting that set up, refer to Wiring Wideband O2 Sensors.
Setting Up Channels
At a bare minimum, you will need to log:- RPM
- Mass Airflow (MAF)
- Volumetric Efficiency Airflow (VE)
- Intake Manifold Absolute Pressure (MAP)
- Air-Fuel Ratio Commanded
- AC Pressure Sensor (assuming your wideband is wired here; otherwise, use your designated WBO2 input)
- Engine Coolant Temp: Prevents logging a cold engine where erratic readings can occur.
- Throttle Position: Useful for advanced filtering.
- Vehicle Speed: Makes visualizing logging runs easier.
2. Setting Up Math Parameters
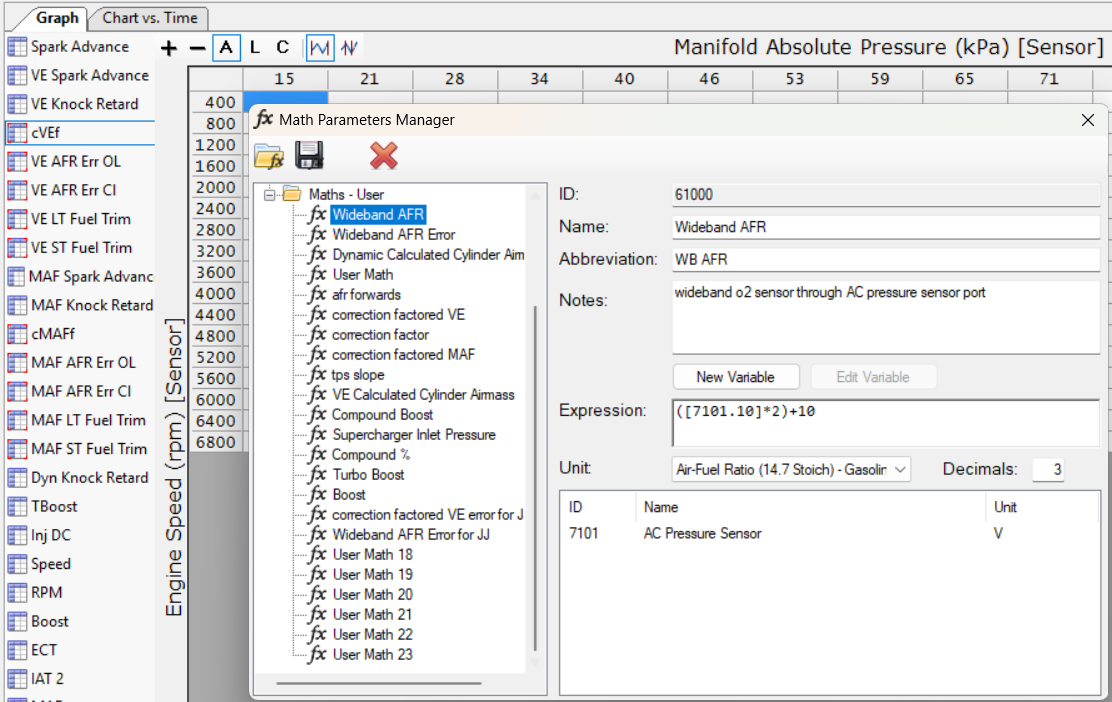
To use wideband data in logging and tuning, set up the following parameters under Tools > Math Parameters:Wideband AFR
This parameter lets you view your current AFR.- Note that ([7101.10]*2)+10 is the specific math for an AEM Wideband sensor (adjust this formula if you are using a different sensor).
- The .10 suffix tells the scanner that the unit is a percentage.
AFR Error
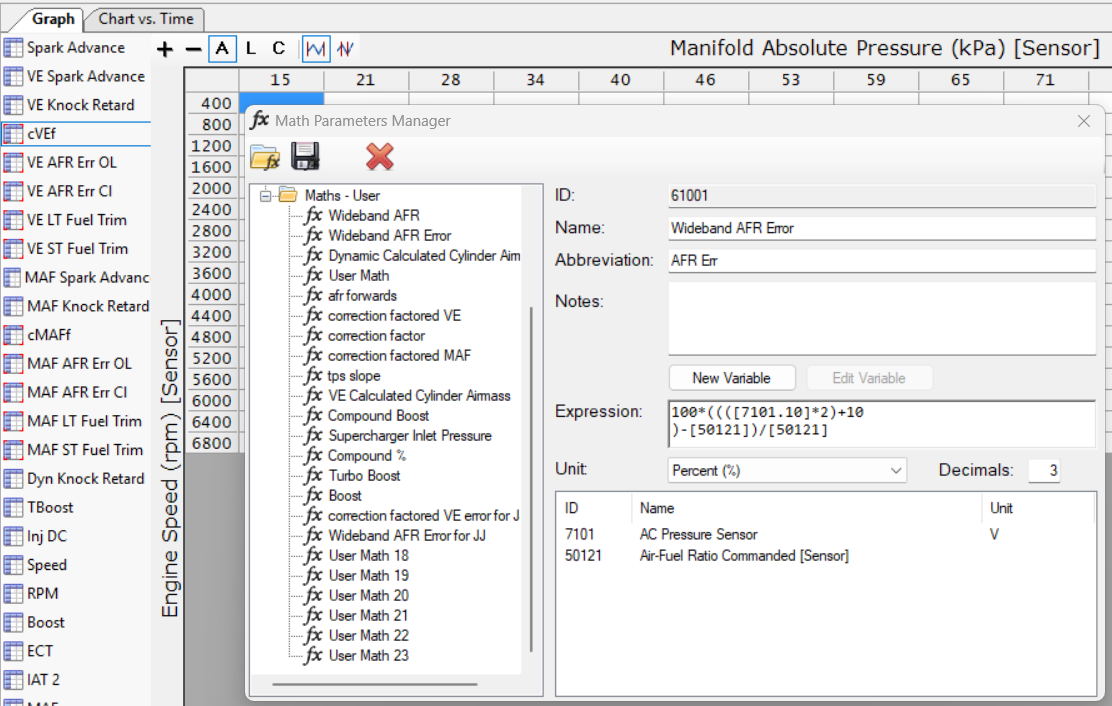
Use the following formula to calculate error:100*((([7101.10]*2)+10)-[50121])/[50121]
- [50121] represents Commanded AFR. Note that the P12 only provides commanded AFR in gasoline units where 14.7 is stoichiometric, rather than lambda.
- Ensure you set this unit as a percentage.
Remember when we said this was a chicken-and-egg exercise? At this juncture, if you're referencing a channel that isn't being logged, the parameter will turn red below (just for demonstration!)
3. Setting Up Histograms (Charts)
HP Tuners is not set up by default for our VE and MAF table axes, so you will need to configure them to match your tune files for easy copy-and-pasting.VE Tuning Chart Setup
Column Axis (MAP):
Row Axis (RPM):15 21 28 34 40 46 53 59 65 71 78 84 90 96 103 109 115 121 128 134 140 146 153 159 165 171 178 184 190 196 203 209 215
Parameter Selection: Choose your custom AFR Error parameter.400 800 1200 1600 2000 2400 2800 3200 3600 4000 4400 4800 5200 5600 6000 6400 6800
Cell Hits: Set the minimum cell hits to at least 20 (or 100 for higher-quality data) to avoid erratic corrections in rarely-touched cells.
Cold Engine Filter: Add a filter to ignore data while the engine is cold (where .242 indicates degrees Fahrenheit):
We can also do something like the below to filter out throttle stabs or sliding your foot off the pedal, as slower transitioning states tend to yield higher quality data. Note this is the absolute value of the slope of the change in the throttle pedal position over the last half second, so if you go from 0 to 51% or 100% to 49% throttle in a half second, that half second's worth of data is not counted... if I haven't changed my math since the last time I checked. If you want to experiment, take a log, set up the chart to display that data, and play with the math.[50010.242]>140
abs([50090.155.slope(500)])<0.5
MAF Tuning Chart Setup
Set up the MAF table chart and copy the Column Axis values exactly:1500 1800 2100 2400 2700 3000 3300 3600 3900 4200 4500 4800 5100 5400 5700 6000 6300 6600 6900 7200 7500 7800 8100 8400 8700 9000 9300 9600 9900 10200 10500 10800 11100
Tip: Turning off closed-loop mode makes the logging process significantly faster.
4. Logging and Applying Data
- Collect Data: Drive around to hit as many table cells as possible.
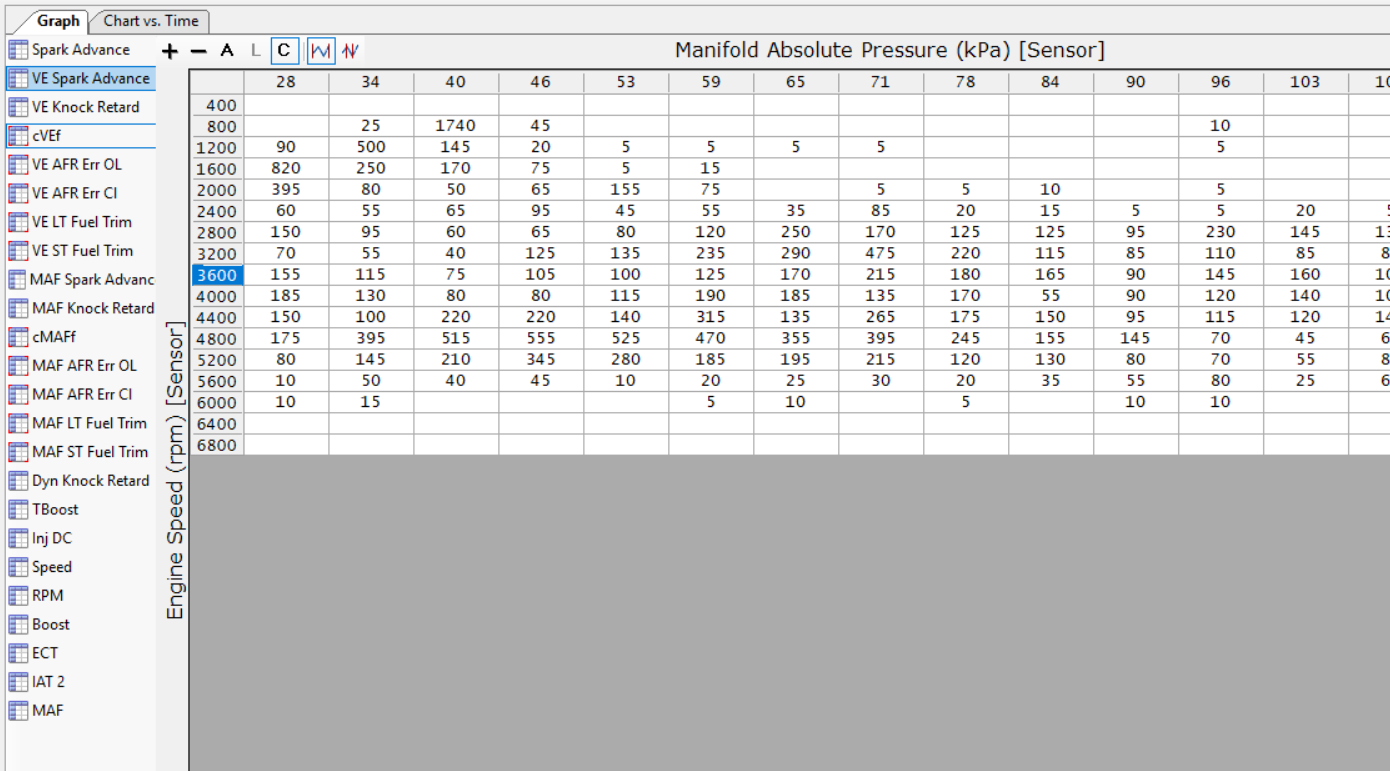
- If you're set up in your tune for VE tuning, you'll only be using the VE WB Error Chart, and vice versa for MAF. Your goal is to drive around and hit as many of the cells as you can. On one hand, you want more counts for higher quality data, on the other hand, if you're just starting out on dialing in a whack tune, you want to make your corrections more quickly. I like 20 for starting out and making big initial jumps, then 100 once you're in the neighborhood. If you click the C at the top of the chart, it'll show your cell hits like below. This was a track day session, but keep in mind I have a lot of filters set up to kick out data I don't want.
If I set minimum cell hits to 100, then click the A at the top to see the average WB Error, it might look something like below. DON'T PAY ATTENTION TO MY NUMBERS, THEY'RE PARTICULAR TO MY SETUP, primarily in that I don't use any VE above 3000rpm where I can already make well in excess of the top of the VE table max of 215kPa (about 31psi absolute - 1 atm = ~16.5psi of boost). Click the top left empty axis cell (where the red arrow is) to copy the whole table, then flip over to your tune.
Flip back over to your tune, go to the VE table, right click anywhere and either Paste Special > Multiply By % or by Half. This is where some discretion and responsibility is warranted. If you have a ton of good data that's significant % error, then by all means go ahead and Multiply by % and do some manual smoothing. If you have some significant % error but only 30-40 cell hits, you may want to Multiply by % Half so as to not overshoot your ideal. If you're taking fuel out of it (green % error in the log), you don't want to overshoot and make it lean, but if you're adding fuel, you don't want to come up short and not make it as rich as it needs to be in correction.
With some restraint, you can also do some manual smoothing, either with the built in buttons (more effectively done by highlighting a cell region and then hitting a smooth/interpolate button) or with your the keyboard. You can see the spike at 40kPa and 800rpm pretty easily in the 3d model (red button). This should probably be smoothed out (and it was, this is an old tune).
When you can go for a drive and have all your error <10%, that's probably close enough. Copy your VE table from your tuning tune back into your main tune and then flash your MAF tuning tune. Process is the same for MAF tuning, except only a single axis.
Once your MAF error is close, copy that data back into your VE tuning tune and your main tune, then you're good to go!
I can also touch on spark tuning, which requires another Math Parameter to set up whereas any LS engine is already preconfigured in HP Tuners. The challenge an LSJ has is, whereas you can do a decent spark tune on the street in an N/A vehicle, with forced induction you're probably going to go past max power before you start knock retarding, so it's not nearly as productive off a dyno.
This is all word vomited out as a first draft, so I welcome corrections or requests for clarifications, including formatting, which I will make in the original post where appropriate.


